
WCM Rendering with Meta tags
Actions

Single Pane of Glass
EventSentry looks beyond events and log files - by monitoring multiple aspects of Windows-based systems to give you a complete picture - and not just a few pieces of the puzzle. Disk space, performance, inventory and more monitoring features are all included.
Real-Time Event Log Monitoring
Our state-of-art agents monitor all Windows servers, workstations & laptops securely, efficiently and in real-time - with native 64-bit support. Data is encrypted & compressed, and collected metrics are cached and re-transmitted during temporary network outages.
Descriptive Email Alert
EventSentry's email alerts go the extra mile to make troubleshooting faster and more effective by providing additional context. Footers provide a status of the monitored host, security codes are automatically explained and performance alerts include embedded visual charts. IP addresses contained in emails are supplemented with reverse DNS lookup and geolocation data.
Real-Time Event Log Monitoring
Since Windows security events are notoriously difficult to decipher and correlate, EventSentry transforms raw security events into easy-to-read reports that immediately make sense. Who ran which application, when did a user logon and from which workstation and which files were changed by whom are only some of the questions you will be able to answer with EventSentry.
Web-Based Reporting & API
A modern, sleek reporting engine that works across all major browsers and mobile devices provides easy access to all logs and metrics. Beautiful & illustrative dashboards can present data from different vantage points, an extensive API provides easy access to third party applications.
Native Active Directory Monitoring
ADMonitor, our new add-on component, allows you to:
- Show object changes down to the attribute level
- Identify idle accounts, disabled accounts, stagnant passwords
- Search a detailed log of Group Policy changes
- Lookup before and after values when a change occurs

Redesigned Management Console
With a fresh look and the new ribbon, configuring EventSentry has never been easier! Many common tasks have been simplified so that working with EventSentry is now more intuitive and faster. The new built-in event log viewer makes viewing event logs, including the new Application & Services logs of Windows, much easier than the built-in Windows event viewer.
Threat Intelligence
EventSentry NetFlow capabilities now include additional levels of detection:
- Alert on malicious IPs
- Detect port scans
- View recent threats on dashboards
Added in EventSentry v3.x
Windows Registry Tracking
Easily normalize Windows registry changes:
- Monitor changes made by a specific program
- Identify registry changes by user
- Search a detailed log of registry actions
- Lookup before and after values when a change occurs


Tag-based Packages
- Easily assign configuration packages based on your specified tags
- Search your environment for resources associated with a certain role or location
Expanded Process Monitoring
- Quickly identify which process is listening on a TCP port
- Track and correlate network activity from Sysmon
- Lookup SHA checksums for running processes
Added in EventSentry v3.4
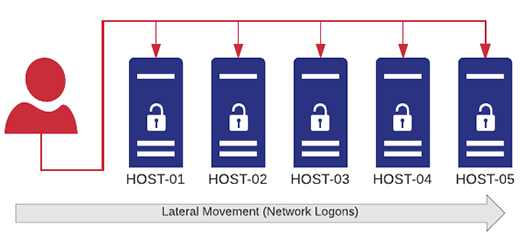
Lateral Detection
Server-side real-time thresholds significantly increase the security of your network by detecting lateral movement and similar activity in a network:
- Same user logging on to multiple hosts within a specific time frame
- A process quickly spreading (trickling) across multiple hosts
- A user running too many processes – either on a single or multiple hosts
- Authentication failures of a user on too many hosts
- Too many unique logon types used by a user account
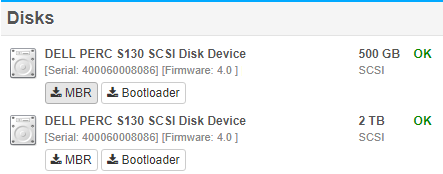
Enhanced Ransomware detection
- MBR/BootSector Monitoring & Backup for easy recovery
- File Entropy describes the randomness of a file, essentially a metric that can help detect compressed and encrypted files.
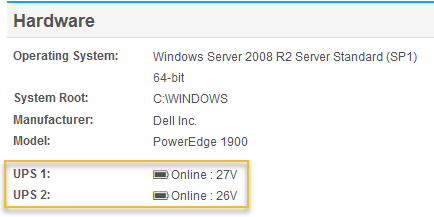
UPS & Battery Monitoring
Any UPS directly attached to a server/workstations that is detected by Windows can now be monitored by EventSentry. The status of the UPS will show up on the host inventory page, and alerts will be generated when a host is on battery power and back on AC power. EventSentry can also initiate a shutdown when the remaining run-time or charge level falls below a certain limit.
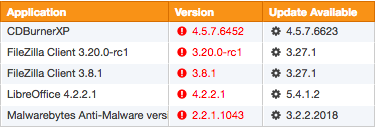
Software Version Checker
In v3.4 we are taking this to the next level by providing the latest version available from the publisher for a growing list of 100+ software packages so that you can effortlessly identify outdated software on your network.
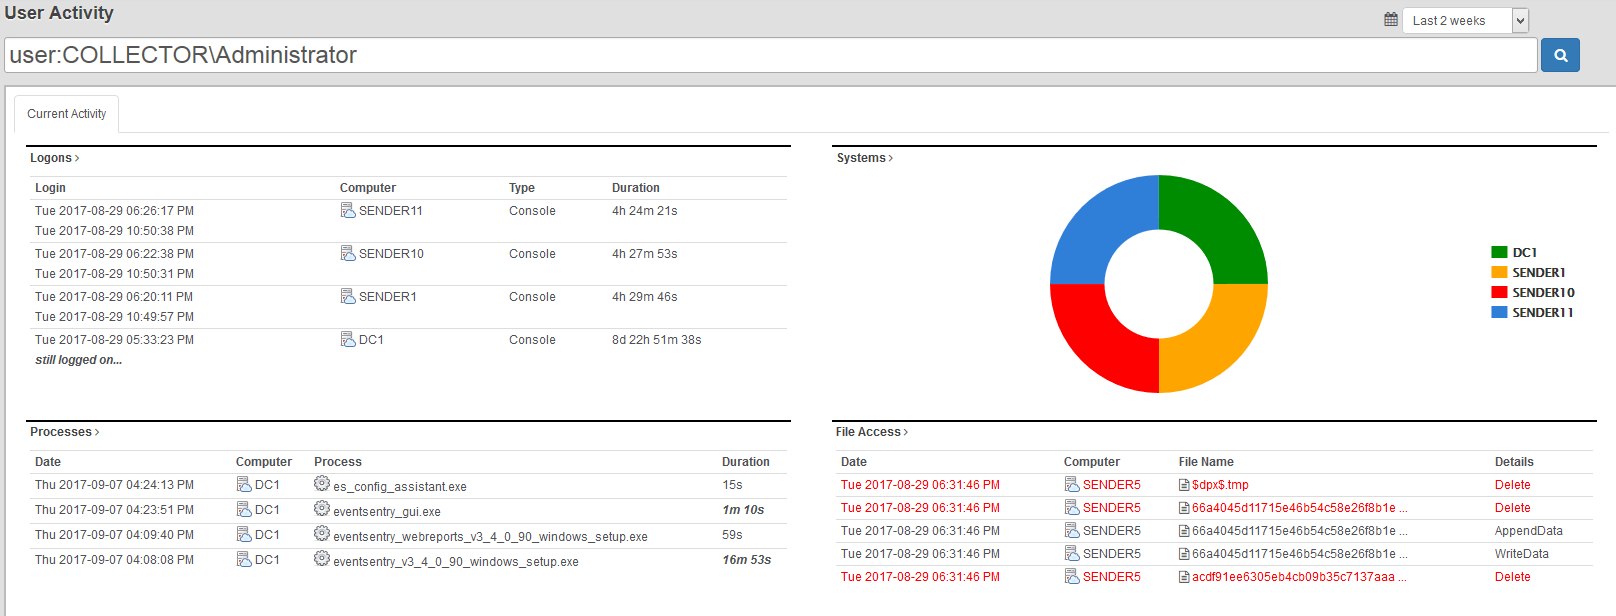
User Activity
The user activity page makes seeing all activity by a user as easy as never before!
- Logons
- Processes
- File Access
- Active Directory Changes
- Tasks
- Events

Audit Policy Status
Reviewing the current audit status of all monitored hosts can be important however, if only to verify that group policies are configured correctly.
- Compare/review audit settings of a particular sub category (e.g. “Registry”) among all monitored hosts
- View all disabled audit settings across all or select hosts
- (Re)view audit settings based on computer types (e.g. domain controllers, servers, workstations)
Expanded Syslog Formats
Starting with version 3.4, EventSentry now supports the following formats in the Syslog action:
- RFC 3164 (legacy)
- Snare
- RFC 5424
- GELF (Graylog)
- Common Event Format (CEF)
- JSON (customizable)
Added in EventSentry v3.3
NetFlow
Collecting NetFlow data allows you to see all traffic metadata which passes through network devices that support NetFlow, including:
- Visualize all network traffic in a variety of ways and reports
- Analyze network data for forensic investigation
- Utilize network traffic data for troubleshooting purposes
- Map network traffic to geo location
- Correlate network traffic with Active Directory users (requires workstation monitoring)
- Measure bandwidth utilization

Notes / Documentation
Communicating and documenting your network has just become a lot easier – add notes and/or upload documents in the web reports. Simply @ mention the computer name and the web reports will associate the update with the respective device on the network.
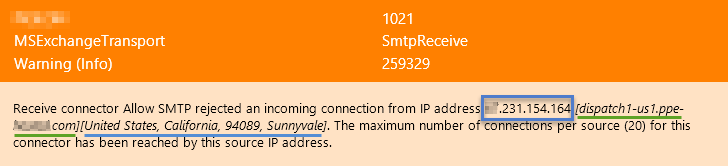
Enhanced Event Messages with GeoIP
EventSentry can automatically extract IP addresses from any event and supplement the IP addresses with reverse lookup and/or Geo IP lookup data. Providing geolocation and/or host names inside the email makes the usability of email alerts for the recipient significantly more useful without requiring the recipient to perform manual lookups.
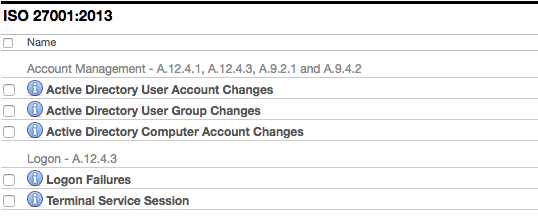
Expanded Compliance Reports
Our compliance module has been updated with new requirements. It is now possible to automate reports to be sent via email or saved directly to a folder.
- PCI-DSS
- FISMA
- HIPAA
- GLBA
- Sarbanes Oxley
- ISO 27001:2013 NEW
Added in EventSentry v3.2
Central Collector Service
A central collector service supports data collection over insecure mediums (e.g. Internet) through strong TLS encryption. Also supports local caching and compression.
- Database
- Email (SMTP)
- Syslog
- Text File
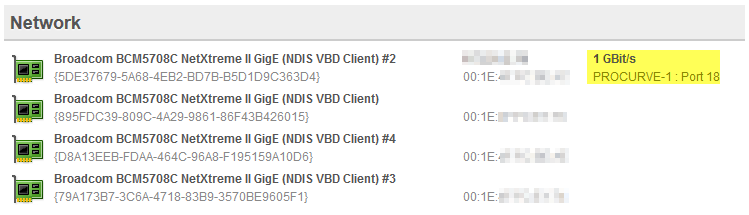
Switch Inventory
Finding the port on a switch to which a server, workstation or network device is connected is often a time-consuming and annoying process for most SysAdmins. Starting with version 3.2, EventSentry tries to ease that pain by showing exactly to which switch – and port – a host is connected to. All you need to do is add the switch to the EventSentry configuration.
Compliance Requirements
The new compliance module will install a number of reports that pertain to the specific compliance requirement that was enabled. Every report will be associated with a specific control (e.g. PCI 10.2.2) and allow you to setup a required review, job and more.
- PCI-DSS
- FISMA
- HIPAA
- GLBA
- Sarbanes Oxley
Enhanced Language Support
Finally, the web reports are now also officially available in 6 additional languages: French, Spanish, Polish, Portuguese, Dutch and Italian. This brings the total number of supported languages in the web reports to 9!
Added in EventSentry v3.1
Multiple Dashboards
Completely overhauled Network Dashboard now offers support for multiple custom dashboards. Share your dashboard and iterate automatically. Also, a new TV mode was added for enhanced viewing on TVs around the office.

Expanded Tile Options
Display the current status of performance, disk space or environment sensor value. We've added heatmaps, gauges, bullet graphs and meters.
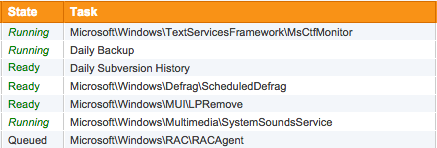
Scheduled Task Inventory
Monitor the scheduled tasks running your network. With change detection you can receive alerts and keep a search history for each task.
Virtual Host Inventory
Quickly see which hosts are running under which servers. Supports Hyper-V and ESX.
- Virtual Machine Name
- Current Status
- Operating System (when available)
- CPU Count
Added in EventSentry v3.0
Powerful Search Queries
The completely redesigned web reports provide several new reporting capabilities with more granular searching syntax to help you find that needle in the haystack.
group:Servers and type:(error or warning) 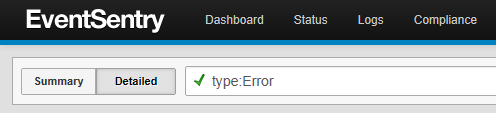

Scheduled Reporting
Any report can now automatically sent via email. Using this functionality you can generate a detailed report on specific error messages across your network or performance trends on your critical servers.
Network Status
Spot problems with a glance with our improved overview pages. With the new customizable dashboards, you can leave page up and ensure you are always looking at a the most recent information.

Cross Platform
We now offer the web reports as a stand-alone installer so you can host your reports any where you would like.
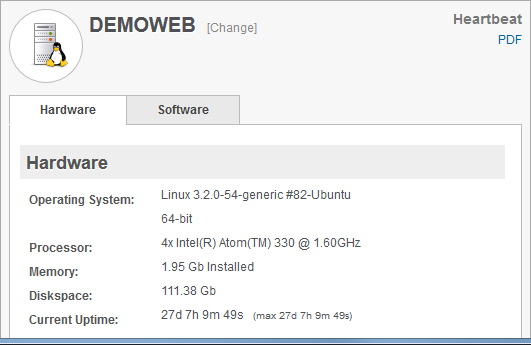
Network Inventory
No more running to server room to look up a service tag number. EventSentry provides a detailed inventory of all your monitored hosts. Quickly see your warranty information, check available memory slots, or identify disk serial numbers.
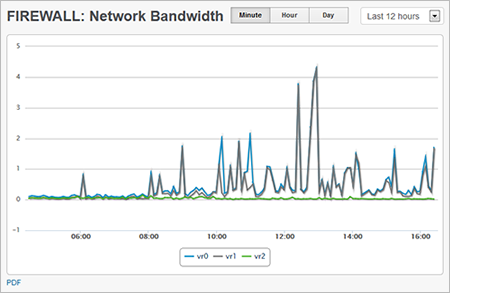
Network Monitoring
It is now possible to poll SNMP counters to check the output load on a UPS or view the network bandwidth trends on your routers and switches.
You can now monitor performance metrics (CPU, avaliable memory, etc) on your Linux machines.
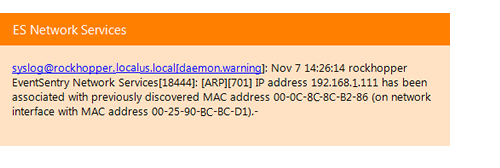
ARP Daemon
The new Arp Watch daemon tracks all network activity on the data link layer to alert you when new devices are added to your network. Network activity is also continuously tracked so that you can see which MAC addresses are actively being used on your network, including MAC to IP address mappings, and when they were last seen. The Arp Watch Daemon also detects ARP Spoof attempts in real-time.


Real Time Event log monitoring is the core monitoring components of EventSentry and its filtering engine gives you countless configuration options to achieve virtually any goal. You define which event log messages you are interested in, and dispatch them to different types of notifications.
For example, you can have database server related messages sent to your dba, while sending all other critical messages to the network administrator.
EventSentry's filtering mechanism is one of the most powerful and flexible available on the market today and can be configured with an easy to use graphical interface. Send event log messages by SMTP email or via syslog, write them to a database or text/html file, (re)start a process or service in response to an event or launch a script or process.
Events can be matched by their basic properties (e.g. event source, category, event id, event message) and by insertion strings inside event messages; wild card matching as well as regular expression matching is also possible. This allows for fine-grained filtering, even supporting numerical comparisons as well as interpreting text inside events as usernames or file names. For example, you can be notified only if a user name that appears inside an event is a member of a specific group, or when a file name that appears inside an event matches a checksum.
Custom as well as the "Application & Services" event logs, introduced with Windows Vista, are fully supported.
Thresholds & Advanced Features
Filter thresholds allow you to become notified when a certain number of events appear during a certain time interval (e.g. more than 10 login failures in 1 minute). Filter thresholds can also be used to suppress events when they reach a certain count.
Threshold can either be evaluated at the agent or - if installed - on the collector. Collector-side thresholds help detect malicious activity like lateral movement (the same user logging into to multiple hosts within a short time period) or processes launching on multiple hosts within a short time period.
The recurring event feature allows you to become notified when one or more events do not occur during a preset time period or interval. For example, you can get notified if a periodically logged event is not occurring, or if a specific task (e.g. a backup) didn't run.
Filters can also depend on the current day or time, making it possible to sends alerts to different notifications depending on when they occur. You can also summarize and collect alerts, and then send out a batch at a given day/time. For example, event logs can be collected during the day, and transmitted to a central database after business hours.
Filter rules can also be set to expire at a certain day and time, making it easy to put temporary filter rules in place that will automatically expire (e.g. maintenance schedules).
Event Log Consolidation
Event Log Consolidation stores all or some event log entries in a central database (Microsoft SQL Server, PostgreSQL 9x and MySQL are currently supported). You can then search for events from the EventSentry web reports or create custom reports. Reports can be exported into a variety of formats, including PDF, JSON, XML and CSV.


EventSentry offers a comprehensive, mobile-friendly web-based reporting system to access all data collected by the EventSentry agents. With the web reports you can search through historical data, review trends, access inventory, view powerful dashboards and much more.
The web reports can be localized and support the following languages:
- English (default)
- Deutsch
- Français
- Español
- Italiano
- Portugês
- Polski
- Dutch
- Japanese
Authentication
The built-in authentication allows you to create users and groups and assign granular permissions to them. This makes it possible to give unprivileged users access to the web reports by only giving them access to pages that do not contain sensitive information. Additionally, permissions can be assigned to computer objects, so that users only have access to information generated by certain computers. This makes it easy and secure to setup a customer portal for providers of hosted monitoring services.
Furthermore, the built-in authentication allows users to maintain their customized settings for the web reports, which will be retained for future sessions.
Multi-Tenancy Monitoring
The web reports support multiple tenants through profiles and its granular access control system. Ideal for large IT teams and MSPs, isolated profiles separate the collected data and give users access to only the data they need and should to see.
Reports
Any query in the web reports (with the exception of some dashboards) can be saved and scheduled as a report. Reports can then be emailed on configurable intervals in HTML, PDF or CSV format.
The following advanced features are available for reports:
- Categories for organizing large amounts of reports
- Associate and adjust user accounts with a report
- Require reports to be reviewed over a certain time period
- Report history


While event log monitoring can relay certain alerts from the operating system, it is unfortunately insufficient for accurately monitoring and tracking a computers health. EventSentry's system monitoring fills this gap, by natively monitoring all core components of the operating system. System Health Monitoring not only raises alerts for immediate problems, but also collects historical information for later analysis, trend prediction and real-time overview.
Service Monitoring & Controlling
Monitors services and/or drivers, and notifies you when their status changes or when services/drivers are added or removed. Service controlling ensures that selected services are always in a requested state (running, stopped).
Compliance: EventSentry's service monitoring helps with PCI requirement 6.4.
Continuous alerts generate alerts until a service is running again. Service monitoring can also keep a log of all service changes in the database.
Disk, Directory Monitoring & History Collection
Issues alerts when the available disk space or directory usage is below a certain minimum (absolute or percentage) and detect changes in disk trend usage. You can also collect disk space information in a database and view comprehensive charts (includes disk space charts, disk reports and directory reports) through the web reports. Directory monitoring can monitor selected directories, and large file detection will discover the largest 250 files on a volume to aid with any disk space cleanup task.
Performance Monitoring
Performance monitoring lets you monitor your servers' system and application performance to detect immediate performance issues and analyze performance trends over time.
You can monitor any performance counter available on the monitored system and either be alerted when a counter exceeds a preset threshold or log counter data in the EventSentry database.
Process Monitoring
Monitors processes (including command line) to make sure the required number of processes is running at all times.
Task Scheduler Monitoring
Monitors and inventories scheduled tasks from the Windows® Task Scheduler. The inventory capability makes all installed tasks (including tasks nested in sub categories) searchable, including configured actions and triggers. Changes to scheduled tasks are logged to the database and can trigger immediate alerts.
File Change & File Integrity Monitoring
File Integrity Monitoring allows you to be notified and track changes to critical system and user files. File monitoring detects when files are added, deleted or changed (SHA checksums are also supported).
Compliance: EventSentry's file integrity monitoring helps with PCI requirement 11.5.
For every directory you monitor, you can specify which types of changes you are interested in. When a change occurs, you can either have an event logged to the event log (and subsequently receive an alert) and/or log the change to the EventSentry database.
Application Monitoring
The application scheduler allows you to extend EventSentry's functionality, by integrating your own applications and/or scripts (e.g. batch files, Powershell, VBScripts, Perl Scripts) into EventSentry. Scripts can be embedded into the EventSentry configuration, integrating the deployment of scripts into EventSentry's update process. Your scripts can be scheduled to run at fixed intervals or specific times. Output from command-line scripts can be captured by EventSentry and sent directly to a notification, such as email. This makes troubleshooting failed scripts easy, since any debug output is immediately captured and available to the reviewer.
Software, Patch & Hardware Inventory
EventSentry monitors and inventories all installed software (32-bit and 64-bit), patches & updates on all monitored hosts. This provides the user with a software inventory that can be used for licensing purposes, patch management/verification and more. (Un)Installed software is detected in near real-time, and alerts can also be generated when software is installed.
In Hyper-V and VMWare® ESXi environments, EventSentry can inventory all virtual machines and their current status.
On supported network switches, EventSentry will tell exactly on which switch and port a particular device is plugged into, so you never have to manually parse ARP tables or follow cables anymore.
EventSentry also captures basic hardware information, including OS Version, OS features as well as hardware (installed memory, NICs, disk controllers) and more.
Hardware Monitoring
EventSentry uniformly alerts you about hardware issues liked failed drives, high temperature and other pertinent issues by forwarding events from the event log(s) via email or other alert types (respective vendor management software / drivers must be installed).
On DELL® and HP® hardware EventSentry also collects data about redundant power supplies, fan speed, temperature, remote access cards as well as installed hard disks and RAID configuration and statuses.
Uptime Monitoring
Uptime Monitoring logs the current uptime of a monitored host to the database in a specified time interval. This feature primarily reports the current uptime, but also keeps a history of all recorded uptimes across multiple reboots, which can help isolate problematic servers that are rebooted often. Uptime Monitoring also records the longest uptime ever recorded on any given host.
Event Log Backup & Clearing
You can use EventSentry to backup and optionally clear event logs at preset intervals. You determine when to backup which event log and whether the event log should be cleared as well. You can also clear event logs without backing them up.
Compliance: Automated event log backups help with PCI requirements 10.2, 10.3 and 10.5.
You can also configure EventSentry to automatically compress event log backup files (.evt and .evtx) in ZIP format to conserve disk space.
NTP Time Synchronization
EventSentry can both verify and synchronize the local time with a RFC 1769 and RFC 1305 NTP server (up to version 3), either in addition to an existing time synchronization (e.g. Active Directory) or as the sole mechanism to synchronize time on all monitored servers and workstations.
Compliance: EventSentry's NTP monitoring helps with PCI requirement 10.4.
When the time between a monitored host and the NTP server is out of sync, then EventSentry will attempt to synchronize the time (if configured) and can also log a message to the event log, reporting the detected time difference.
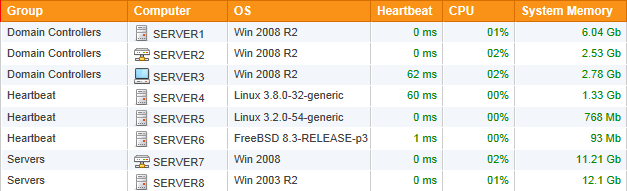
Dashboard
The highly customizable EventSentry Dashboard shows you the overall health status of your network at a glance with easy to read status and historical tiles. The dashboard shows you the following information:
- Any performance counter (e.g. CPU, memory, bandwidth)
- Any system status (service, disk space, ...)
- Top performance utilizors (e.g. processes using most CPU)
- Heartbeat Status
- General System Information
- Data from any report (e.g. currently logged on users, service history, ...)
- Log volume trend


Many companies, whether located in the United States or elsewhere, are faced with the challenge of complying with increasingly demanding government regulations such as
- Sarbanes-Oxley
- PCI Compliance
- Health Insurance Portability and Accountability Act (HIPAA)
- SB1386 (California)
- Gramm-Leach-Bliley Act
- CJIS Security Policy
- Controlled Unclassified Information (CUI) Compliance
- NIST 800-171
and more. Many companies are already using EventSentry to help them to fulfill regulatory compliance. EventSentry helps them become compliant with minimal effort and great flexibility - at a reasonable price.
Due to its flexible design, EventSentry can help you meet many government regulations in a variety of ways:
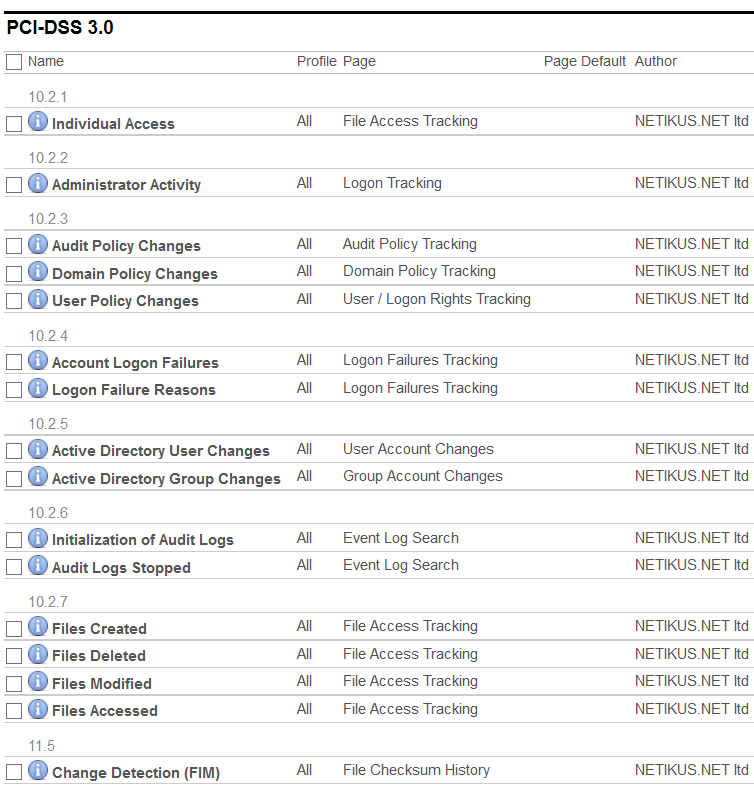
1. Compliance Modules (Reports)
The built-In compliance reports ease the burden of compliance by listing exactly which individual compliance requirements EventSentry is capable of fulfilling. Then, simply set the required review parameters (e.g. daily, weekly) or schedule the reports as jobs. The following regulatory frameworks are currently covered by the compliance module:
- PCI-DSS 3.0
- FISMA
- HIPAA
- Sarbanes Oxley (SOX)
- GLBA
- ISO 27001:2013
- NIST 800-171
2. Compliance Tracking
Compliance tracking intercepts and normalizes security-related events from the Windows event log, and consolidates them in the EventSentry database. This includes Active Directory Change Reporting (e.g. Account Management Tracking) as well as tracking of user activity (e.g. Logon Tracking). In full, compliance tracking includes the following features:
- Console Logon Tracking
- Process Tracking
- File Access Tracking
- Account Management Tracking
- Policy Change Management Tracking
- Print Tracking
3. Real-Time Event Log Monitoring
Since a core feature of EventSentry is to monitor the security event log of Windows-based computers, you can configure EventSentry to perform a variety of tasks including:
- Immediate Email notification of critical events
- Immediate Email notification of break-in attempts, configured with thresholds
- Notification of software errors and failed services
- Collection and archival of all events in a SQL database, searchable through web reports
- Archival of event logs in a central location
- and many more.
4. System Health Monitoring
Depending on your specific compliance needs, many of the system health monitoring features also supplement the compliance tracking and event log monitoring features.
EventSentry provides the following additional functionality to achieve compliance:
- File Integrity Monitoring (FIM)
- Software & Patch Monitoring, including notification of added software and patches
- NTP Synchronization
- Service Monitoring, including notifying of added or removed services


Active Directory Monitoring with ADMonitor
EventSentry can monitor all changes to Active Directory and Group Policy objects down to the attribute level with ADMonitor, an optional Add-On.
Since Active Directory is a central database that stores all users, groups and computer objects of an organization, tracking all activity is crucial in order to maintain a secure network. Idle users and undetected changes can seriously compromise the security of a Windows domain.
Monitoring Active Directory changes using the security event log however is difficult, inefficient and cumbersome. ADMonitor solves this problem by monitoring Active Directory directly - with little reliance on the security event log.
ADMonitor offers the following functionality:
- Show all object changes down to the attribute level
- User inventory that Identifies idle accounts, disabled accounts, stagnant passwords and more
- Group Policy changes with before and after value
- Extensive reporting and alerts
ADMonitor completely integrates with EventSentry and is usually setup in less than 2 minutes.
Built-In Functionality vs ADMonitor
| Feature | EventSentry Built-In | EventSentry ADMonitor |
|---|---|---|
| Detect User & Group Changes | Yes | Yes |
| Detect Any Attribute Change | No | Yes |
| Before & After Values | No | Yes |
| Requires Detailed Auditing | Yes | No |
| Monitor Group Policy Changes | No | Yes |
| Identify Problematic AD User Accounts | No | Yes |
| Detect Local (Non-AD) User & Group Changes | Yes | No |
| Licensed Separately | No | Yes |
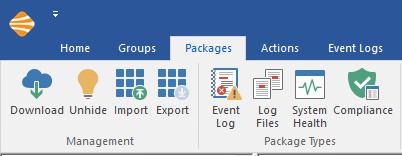
Package Management
EventSentry can be easily configured using Event Log, Log File, Health and Tracking packages. Packages contain one or more monitoring objects and are either assigned globally, to computer groups or to individual computers. EventSentry ships with a number of pre-configured packages which mostly exclude unwanted events from being sent to your email notifications. These packages are constantly under development and can be downloaded from within the management application. Packages contain information such as:
- Event log filters which instruct EventSentry to forward one or more events to a notification (e.g. email)
- Log File rules which instruct EventSentry how to consolidate and process log files (flat files)
- Disk Space Monitoring settings (e.g. alert when disk space is below 500Mb on C drive)
- Service Monitoring settings (e.g. alert when any of the IIS services is not running)
- Performance Monitoring settings (e.g. which counters to monitor and their respective alert settings)
- Logon Tracking settings (e.g. track all logon information)
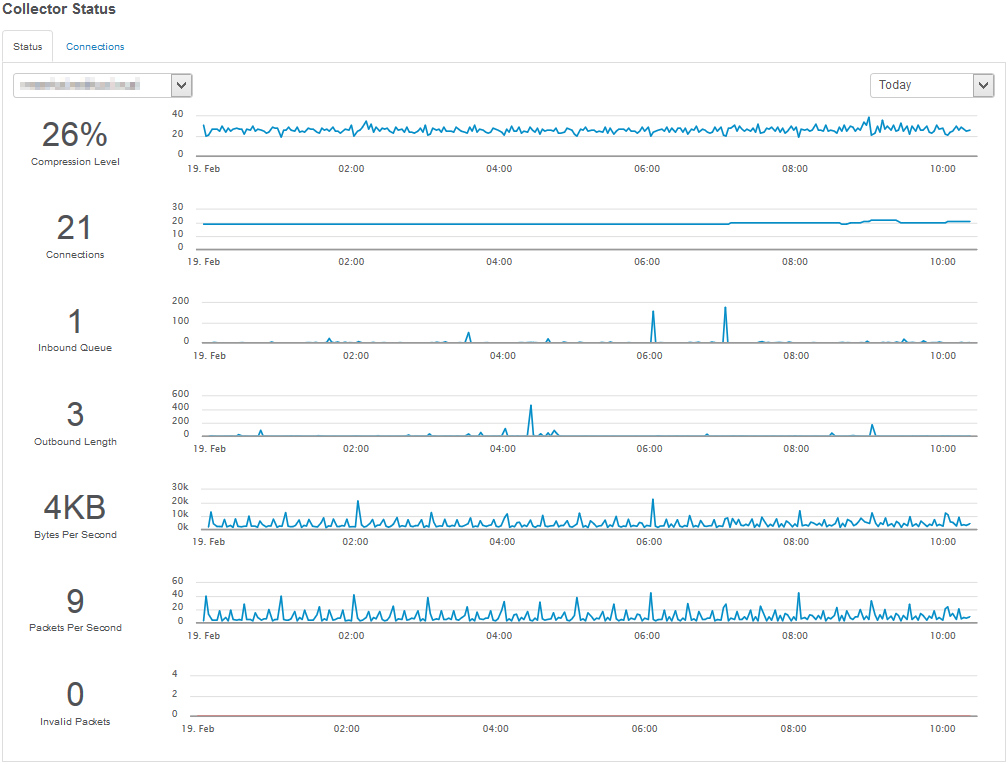
Collector Service
The collector is a central component which enables a 3-tier architecture in EventSentry and sits between the remote agents and the service (usually the database or email service). In a nutshell, it provides the following benefits:
- Agents only communicate with the collector over a single port
- All traffic can be encrypted and compressed
- Database connection details do not need to be stored on the agents
- All collected data is cached on the agents if and while the collector is unreachable
- Configuration & Agent updates can be deployed automatically
- Mobile clients can continue to securely transmit logs and other metrics over the Internet without interruption
Remote Update
Remote Update allows you to easily administer and update monitored computers running the EventSentry agents. With the multi-threaded remote update feature you can push out the latest agents (e.g. after an update or a patch installation) but also send the latest configuration to the remote computers quickly and easily. Remote update supports managing servers and workstations from different domains.
The remote update procedure can also be completely automated using the command-line Remote Update utility, which can be scheduled to run at regular intervals (e.g. twice a day) through the Windows scheduler and will ensure sure that:
- All agents have the latest configuration
- All computers have the latest agent installed
- All computers have the agent installed and running
If one or more of your computers groups are linked to an Active Directory OU or group then the Remote Update Utility can also automatically install the agent on computers that were added to the linked OU or group.
Host Management
Hosts can be added to the management console in a variety of ways:
- Added manually
- Imported from a text file
- Imported from a network (IP) scan
- Imported from an Active Directory OU or group
- Imported from the legacy Windows network neighborhood


Log File Monitoring allows you to both consolidate text from log files in the EventSentry database as well as receive alerts when certain text patterns are found in a log file. Log File Monitoring supports the following types of log files:
- Non-Delimited Log Files: This includes files that do not follow a pattern, such as development debug files and the NTBackup log files.
- Delimited Log Files: This includes files that follow a pre-defined pattern and are delimited with a common delimiter (e.g. , : etc.), for example the IIS log files.
Unlike many other log file monitoring solutions that only support a limited number of log file formats (e.g. IIS), EventSentry allows you to map the format of any delimited log file in EventSentry, which means that you can consolidate pretty much any delimited log file into the EventSentry database. You can then search and create reports based on any field / column from these log files.
EventSentry also ships with a database import utility that can be used to import log files into the database manually or on a scheduled basis (command-line options are supported) if real-time monitoring is not desirable or possible for any reason.
Log File Monitoring Alerts
You can configure EventSentry to log an alert with a customizable severity to the Application event log when a monitored log file contains one or more strings of interest. For example, you can receive an email if the NTBackup log file contains the string "Warning:".
Log File Monitoring Consolidation
In most cases you will want to consolidate log file information into the EventSentry database so that you can archive and search log files from one central location. As mentioned earlier, you can consolidate both non-delimited and delimited log files with EventSentry.
Delimited Log Files
Consolidating data from delimited log files is flexiable and powerful, as EventSentry parses each line and splits the data into their respective data types and thus lets you create reports and searches based on information contained in particular fields. For example, you can create a report that will show you the percentage of files in an IIS log that returned a 404 "File Not Found" error.
Non-Delimited Log Files
Consolidating data from non-delimited log files on the other hand simply stores each line from the log file in the database. This is necessary when the log file does not follow a pattern, and you can still search across multiple files and computers from one central interface.


Provides unparalleled insight into your network by correlating a number of powerful monitoring components, including ICMP & TCP checks, active & passive SNMP, NetFlow & sFlow traffic analysis, ARP monitoring, switch port mapping and more.
Network / SNMP Monitoring
In addition to monitoring Non-Windows machines with PING and TCP port checks, you can monitor any SNMP-capable device (versions 1, 2c & 3 are supported) such as Linux servers, routers and switches using SNMP. The following information can currently be monitored/collected:
- System Information (OS, platform, serial number)
- Basic Hardware (processor, installed memory, network interfaces)
- Current Uptime
- Mounted disks incl. disk space usage
- Running processes
- Any numerical SNMP counter (CPU usage, memory utilization, network bandwidth ...)
- Basic availability with PING
- TCP port availability
In order to minimize the time it takes to detect a problem, EventSentry scans & monitors all remote hosts in parallel, utilizing multiple threads.
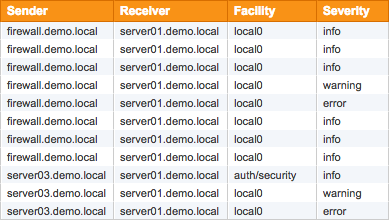
Syslog Daemon
Collect and consolidates Syslog data from any device that supports the Syslog protocol. EventSentry's syslog daemon (UDP and TCP are both supported) can be configured to consolidate incoming Syslog messages to the central database and/or log incoming Syslog messages to the Windows Application event log (Syslog to Event Log). The Syslog daemon can be configured to accept/reject messages based on their content, facility, severity or IP origin.
Using the web-based reporting, you can search across all collected Syslog data from your entire network.
 The syslog protocol is supported by various Unix/Linux flavors (e.g. Linux ©, RedHat ©, SUSE ©, OpenBSD, NetBSD, FreeBSD, Sun © Solaris ©, Apple © OSX 10.x, various Cisco and other high-end network devices).
SNMP Trap Daemon
The SNMP trap daemon, part of the network services, logs incoming SNMP traps (v1, v2c and v3 are supported) to the event log and/or consolidates the traps in the central EventSentry database. SNMP traps can be accepted/rejected based on a contained OID or content (payload).
The SNMP trap daemon is easy to configure, and supports both privacy and authentication. For an easy setup, SNMP v3 users can be configured for a single engine ID or multiple engine IDs.
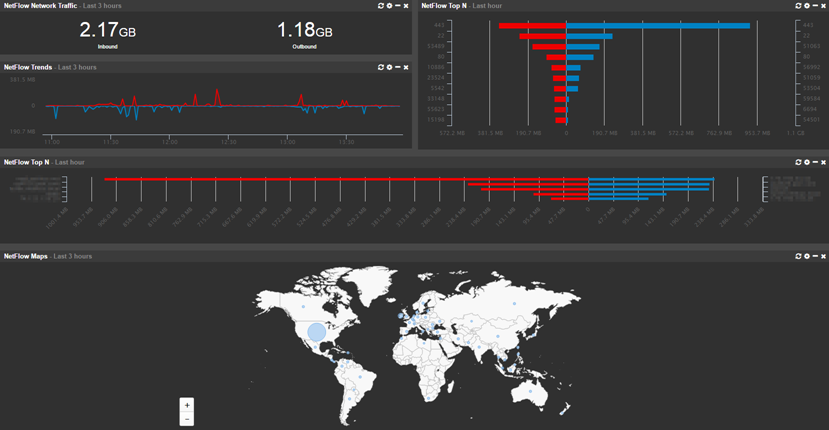
NetFlow
NetFlow is a separately licensed component and supports the collection of NetFlow v1, v5, v9 as well as sFlow flow data. Collecting NetFlow data allows you to see all IP traffic meta data from devices which support NetFlow, such as routers and switches.
EventSentry's unique NetFlow implementation lets you:
- Visualize all network traffic in a variety of ways and reports
- Analyze network data for forensic investigation
- Utilize network traffic data for troubleshooting purposes
- Map network traffic to geo location
- Correlate network traffic with Active Directory users (requires workstation monitoring)
- Measure bandwidth utilization
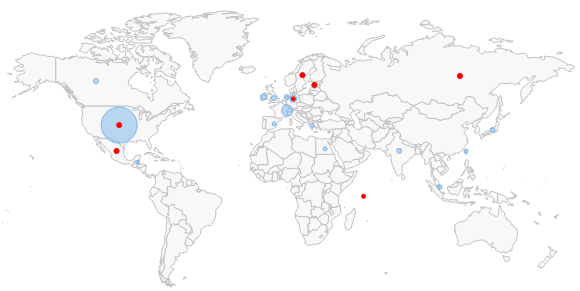
Geo Location
EventSentry ships with the GeoLite geo database from MaxMind which does a good job of associating IP addresses with physical locations down to the city level. If you are looking for more accuracy however, then you can also purchase the full geo location database from MaxMind here.
Active Directory User Correlation
A unique feature of EventSentry's NetFlow implementation is the ability to correlate workstation logins with network traffic, making it possible to associate network traffic with individual users. This requires that workstations are monitored with EventSentry and works best when users have a dedicated workstation.
Switch Port Mapper
The SNMP-based switch port mapping component automatically identifies to which switch port a device is connected to without the need to trace cables in the server room. The switch port mapper works automatically for any switch that is monitored with EventSentry, and works on switches of any vendor which support this functionality (download the free SnmpTool to see if your switch is supported).
By correlating MAC addresses with data gathered from other EventSentry features (e.g. ARP monitoring, host inventory), the switch port mapper can not only show the MAC address, but often also show the IP address and/or host name of the connected device, making troubleshooting a breeze!
ARP Monitoring
The ARP watch daemon, part of the network services, actively monitors all network traffic to
- Detect devices added to the network
- Keep track of MAC address usage
- Detect ARP spoof attempts
Notification Methods
Since all heartbeat notifications go through the event log, you can take full advantage of EventSentry's notification types as well as sophisticated event log processing engine. For example, you can notify different recipients based on the type of host that is down, or time of day.
Status and History Reports
In addition to being notified when a host or service go offline (or back online), EventSentry offers a heartbeat status web page that will show you at a glance which hosts and services are currently online or offline. A heartbeat history page will show you a complete history of all status changes. Both the status and history page are either HTML pages constantly update by the agent, or saved to a database where the status and history reports can be viewed through the web reports, which offers additional search features.
Monitoring through PING
You can monitor remote ip hosts by sending fully-customized ICMP packets. This monitoring type offers the following features:
- Configure the amount and size of the ICMP packets to send to the remote host
- Configure the desired success rate (e.g. 50% of packets should be acknowledged)
- Configure the desired average response (e.g. 500ms)
Monitoring HTTP/HTTPS web pages
EventSentry can monitor any HTTP/HTTPS page for availability with the application scheduler and the free CheckURL utility. Be notified when a page's checksum changes and ensure that a given content does (or does not) appear on the page.
Monitoring database availability
EventSentry can monitor any database which offers ODBC drivers for availability with the application scheduler and the free CheckDB utility. The utility will connect to the database, authenticate, and optionally run a SQL statement and check its return code.
Monitoring network services through TCP
In addition to or instead of PING monitoring you can verify that remote services listening on TCP ports (e.g. POP3, HTTP, SMTP etc.) are active. You can specify multiple ports when monitoring a host.
Monitoring EventSentry Agents
For computers running Windows and the EventSentry agents, monitoring the EventSentry agents will ensure that your servers and workstations are being monitored. This feature will ensure that the EventSentry service is in a running state on the monitored computers.
Ping Latency
Ping response times can be recorded in the database and visualized through the web reports.
Availability
The heartbeat availability page shows you the uptime of all monitored hosts (based on PING) in percent, useful when you need to fulfill service level agreements (SLA) or simply to see which hosts are most reliable. The report includes the total uptime, total downtime, total time monitored and the calculated uptime in percent.
Advanced Features
- Hosts in a heartbeat-group can be flagged as a router in order to suppress duplicate heartbeat alerts
- Only check agents or TCP ports when a PING was successful to avoid duplicate notifications
- Immediately repeat a check that failed to avoid receiving notifications on temporary outages
- Require X failed checks to trigger an error in the event log
- Maintenance Schedules allow you to suppress alerts during scheduled maintenance periods


EventSentry offers a full range of environment monitoring sensors to notify you of environment problems like defective air conditioning, intrusion attempts, water leaks and more. EventSentry monitors the following:
- Temperature
- Humidity
- Motion
- Smoke
- Water
EventSentry will generate an alert if the current measurement is outside the configured range (e.g. temperature and/or humidity) or if motion, smoke or water are detected.
Network-based Hardware Sensors
EventSentry fully supports the network-based HWg-STE temperature and/or humidity sensors developed by HW group via the SNMP protocol. The HWg-STE sensors have two inputs and can measure either temperature, humidity or both. EventSentry comes with a pre-defined performance/snmp package and MIB and supports both alerts as well as historical trending for temperature and/or humidity data.
Directly Attached Hardware Sensors
All of our sensors are high quality products made in Germany and come with a three-year warranty. The following hardware is currently available:
Serial Adapters
- 30201: 1-Port Serial Adapter (connect one sensor)
- 30203: 2-Port Serial Adapter (connect up to two sensors)
- 30205: 4-Port Serial Adapter (connect up to four sensors)
Sensors (require serial adapter)
- 30101: Temperature Sensor
- 30103: Humidity Sensor
- 30111: Smoke Sensor
- 30114: Motion Sensor
- 30115: Water Sensor
Combination Sensors (do not require serial adapter)
- 30106: Temperature & Humidity Sensor (requires USB & serial port)
- 30602: Temperature & Humidity Sensor (requires USB port only)
All sensors, with the exception of sensors 30106 and 30602, require a serial adapter with at least one available connection. You will not be able to connect a sensor directly to the serial port without a serial adapter.
Examples
The examples below should help if you are unsure as to which parts to order:
1. Monitor temperature (and humidity) with a network sensor
You will need to purchase the "HWg-STE Ethernet Temp Sensor" or "HWg-STE Ethernet Temp+Humidity Sensor". You will also need one network-device license.2. Monitor only temperature
You will need to purchase the 1-port serial adapter 30201 and the temperature sensor 30101.3. Monitor motion and smoke (from one computer)
You will need to purchase the 2-port serial adapter 30203, the motion sensor 30114 and the smoke sensor 30111.4. Monitor smoke and water (from two computers)
You will need to purchase two 1-port serial adapters 30201, the smoke sensor 30111 and the water sensor 30115.5. Monitor temperature and humidity (from one computer)
You only need to purchase the "Temperature and Humidity Serial Sensor".
Alerts, Remediation & Integration
EventSentry currently supports 16 different types of notifications. Some are useful for immediate notification (such as email or syslog) while others are useful for collection and consolidation. Most actions will cache pending data if the service (e.g. email server, database) are temporarily unavailable. All notifications support thresholds as well as a schedule.
 |
Email (supports SSL/TLS, header/footer, variables, mini format for cell phones etc.) |
 |
Instant Messages (through Jabber - e.g. Google Talk), supports chat rooms |
 |
Database (MSSQL, PostgreSQL, MySQL or Oracle) |
 |
Pager (through SNPP) |
 |
Syslog (TCP + UDP) |
 |
SNMP (v1, v2c and v3 Traps) |
 |
Process (executes any process/executable) for remediation |
 |
Submit HTTP(S) forms |
 |
Shutdown or Reboot |
 |
Service & Process Control (Stop, Start, Restart, Continue, Pause) |
 |
Text File (ASCII, HTML, CSV) |
 |
Sound (play .wav file) |
 |
Network (aka "net send"), Printer, Desktop & RSS |
Email Notifications (SMTP)
Forwards any alert via SMTP (SSL/TLS with authentication supported) to one or more recipients. Supports primary and secondary SMTP server, as well automatic SMTP server lookup via DNS (MX record). The email subject can be customized using dynamic variables, the email content itself can also be customized by only selecting event properties of interest. The action supports a HTML, plain text as well as SMS/text message type format with minimal information; a customizable header and footer can be configured as well. Email actions can also dial a configured RAS/VPN connection when necessary, prior to sending the email.
HTTP(S)
Submits a web-based form via HTTP(S) or performs a POST/PUT request with support for JSON/SOAP. Supports basic, digest and NTLM authentication. Using the HTTP action, alerts can easily be submitted to ticketing systems such as Trello, Slack, HipChat, iService, FogBugz and many others.
Processes
Starts a process with low, medium or high priority. A maximum process runtime can be configured, and the process (including child processes) can be killed when the runtime is exceeded. The process return code (ERRORLEVEL) can be evaluated, and output can be logged to the event log.
The process command-line can be fully customized with custom variables as well as with dynamic event variables. Embedded scripts can also be used with a process notification.
Service and Process Control
Controls a service (start, stop, restart, pause, continue) or terminates (kills) a process. Multiple instances of the same process may be terminated, as well child processes.
Advanced Features
All notifications support thresholds, to ensure that "expensive" notifications such as text message, pager, email don't get flooded with events, regardless of the filter rules.
Schedules can be applied to notifications, which ensures that an action is only active during a certain hour of the day.
Alert-type notifications such as email and pager can log their activity to the EventSentry database, to support later auditing for accountability and troubleshooting purposes.
Fault Tolerance
Actions not supported by or not routed through the collector or EventSentry supports fault-tolerance for certain notifications, and will cache events when certain notifications are unavailable. Delivery will be re-attempted in regular intervals until the remote service is available again. This ensures 100% reliability during temporary network outages.
All actions routed through the collector are automatically fault tolerant, otherwise the following notification types support fault tolerance:
- Database (ODBC)
- SMTP
- SNPP
- Syslog (TCP only)
- HTTP
- Network (net send)


The web reports allow you to easily search for a pattern of events across your network, whether on servers, workstations or on network infrastructure devices. The query interface is extremely flexible and allows for both regular queries as well as statistical information about events. The new reporting feature allows you to create categorized reports that can be exported to CSV or used as a source for RSS feeds.
The web interface also allows you to view disk space, performance and environment monitoring (optionally) trends by using graphical charts and disk space reports to quickly visualize large amounts of collected information. Nearly all information that EventSentry collects can be stored in the central database, including compliance tracking information, software / hardware inventory, file checksum status and much more.
EventSentry also ships with a database import utility that can be used to import event log backup files into the database either manually or on a scheduled basis (command-line options are supported) if real-time monitoring is not desirable or possible for any reason. You can also use this utility to add event log backup files to the EventSentry database that were created before you started using EventSentry for real-time monitoring.
Protection
Event Log Consolidation also gives you an added layer of protection in case event logs on the devices themselves should ever become unusable due to tampering or corruption.
EventSentry is one of the few event log management suites available that uses an open database format and supports multiple databases, including Microsoft SQL Server, Oracle, MySQL and Microsoft Access. The web reports are open-source and require IIS 5 or later.
Back in Time
Wouldn't it be nice if you could go back in time after a critical server crashed (blue screen of death - BSOD) or became otherwise unavailable? By consolidating event log, process, disk space and other information in a central database, you can see exactly what happened before the server became unavailable - using only a web browser. This can help you save a tremendous amount of time when troubleshooting a server that will no longer boot or is otherwise experiencing problems. With EventSentry, you can view information such as:
- The last errors or warnings logged to the Application and System event log
- The last Audit Success or Failures logged
- The last processes that were created or exited
- The most recent service status changes - was a service or driver added that caused problems?
- How much disk space was available - how were the disks partitioned?
- Who was logged on at the time the server crashed?
- and much more.
Videos
EventSentry Introduction
EventSentry - Connecting to the imageRUNNER ADVANCE
Defending against data loss and cyberattacks is crucial for any successful organization. Network devices can be compromised by individuals or be an entry point for external attacks in a myriad of ways. In this video, learn how EventSentry, a powerful SIEM (Security Information Event Management) solution, can help aggregate data, analyze and isolate suspicious activity in real-time, and support the security of various network devices, including Canon imageRUNNER ADVANCE MFDs.
Infographics
SIEM Integration
